
Pro Metering | RONE Analyzer Complete Guide · 5 min · Watch on YouTube
1Welcome to RONE Analyzer
RONE Analyzer is a measurement window that stays open all session, on a second monitor or over the DAW. It is one picture of the whole mix: the spectrogram on the left, the level meters in the middle, the vectorscope with correlation, NOTE and the reference strip on the right, and the LOUDNESS panel under the spectrogram when you want it. It reads your DAW's master through the included RONE Analyzer Bridge plugin, whatever the computer is playing, a hardware input, or a file.
Two plugins come with it. The Bridge goes last on your master: it sends the mix to the analyser bit for bit, and it is the only source where band solo, zone solo and the mono fold are heard in the DAW itself. RONE Analyzer Channel goes on any mixer channel - KICK, BASS, VOX - and that channel's spectrum is drawn over the master in its own colour.
The instruments
- Spectrogram - thirty third-octave bands of LEDs with held peaks, or WAVES, an FFT spectrum drawn the way spectrum analysers everyone knows draw it. Zones you can solo by ear, bands you can press to hear, SIDES in violet, your Channels in their colours and a reference record drawn over it all.
- Level meters - RMS and PEAK per channel, MAX PEAK and MAX RMS, overs that stay lit until you reset them.
- Vectorscope - the stereo image as a phosphor trace, correlation, left / right balance, and a second scope for the reference or a Channel.
- NOTE - the note under the mix, the fundamental of the bass or the kick, in a pop-out window if you like.
- LOUDNESS - EBU R128: momentary, short-term, integrated, range, true peak, against a CLUB, STREAM or EBU target.
- BAR SCOPE - the waveform locked to the DAW's bar, from 4 bars down to 1/8, with the Channels drawn in.
The 10-second version
- Open RONE Analyzer.
- Put RONE Analyzer Bridge last on your DAW's master. The analyser picks it up by itself.
- Read the spectrogram, the meters, the scope.
- REFERENCE → load a record you admire. Its curve sits over your bars.
- Press F1 for the built-in tour of everything.
Why third-octave bands
An FFT has linear bins; an ear does not. The spectrogram runs thirty real bandpass filters on the standard third-octave centres from 25 Hz to 20 kHz, so every band is a third of an octave wide and a tone reads its own level. When you want the familiar FFT picture, WAVES is one key away.
2Installation with the RONE Plugins Center
Every RONE product is installed, updated and licensed through one application: the RONE Plugins Center. You never download individual installers by hand, and you never enter serial numbers into the plugin itself.
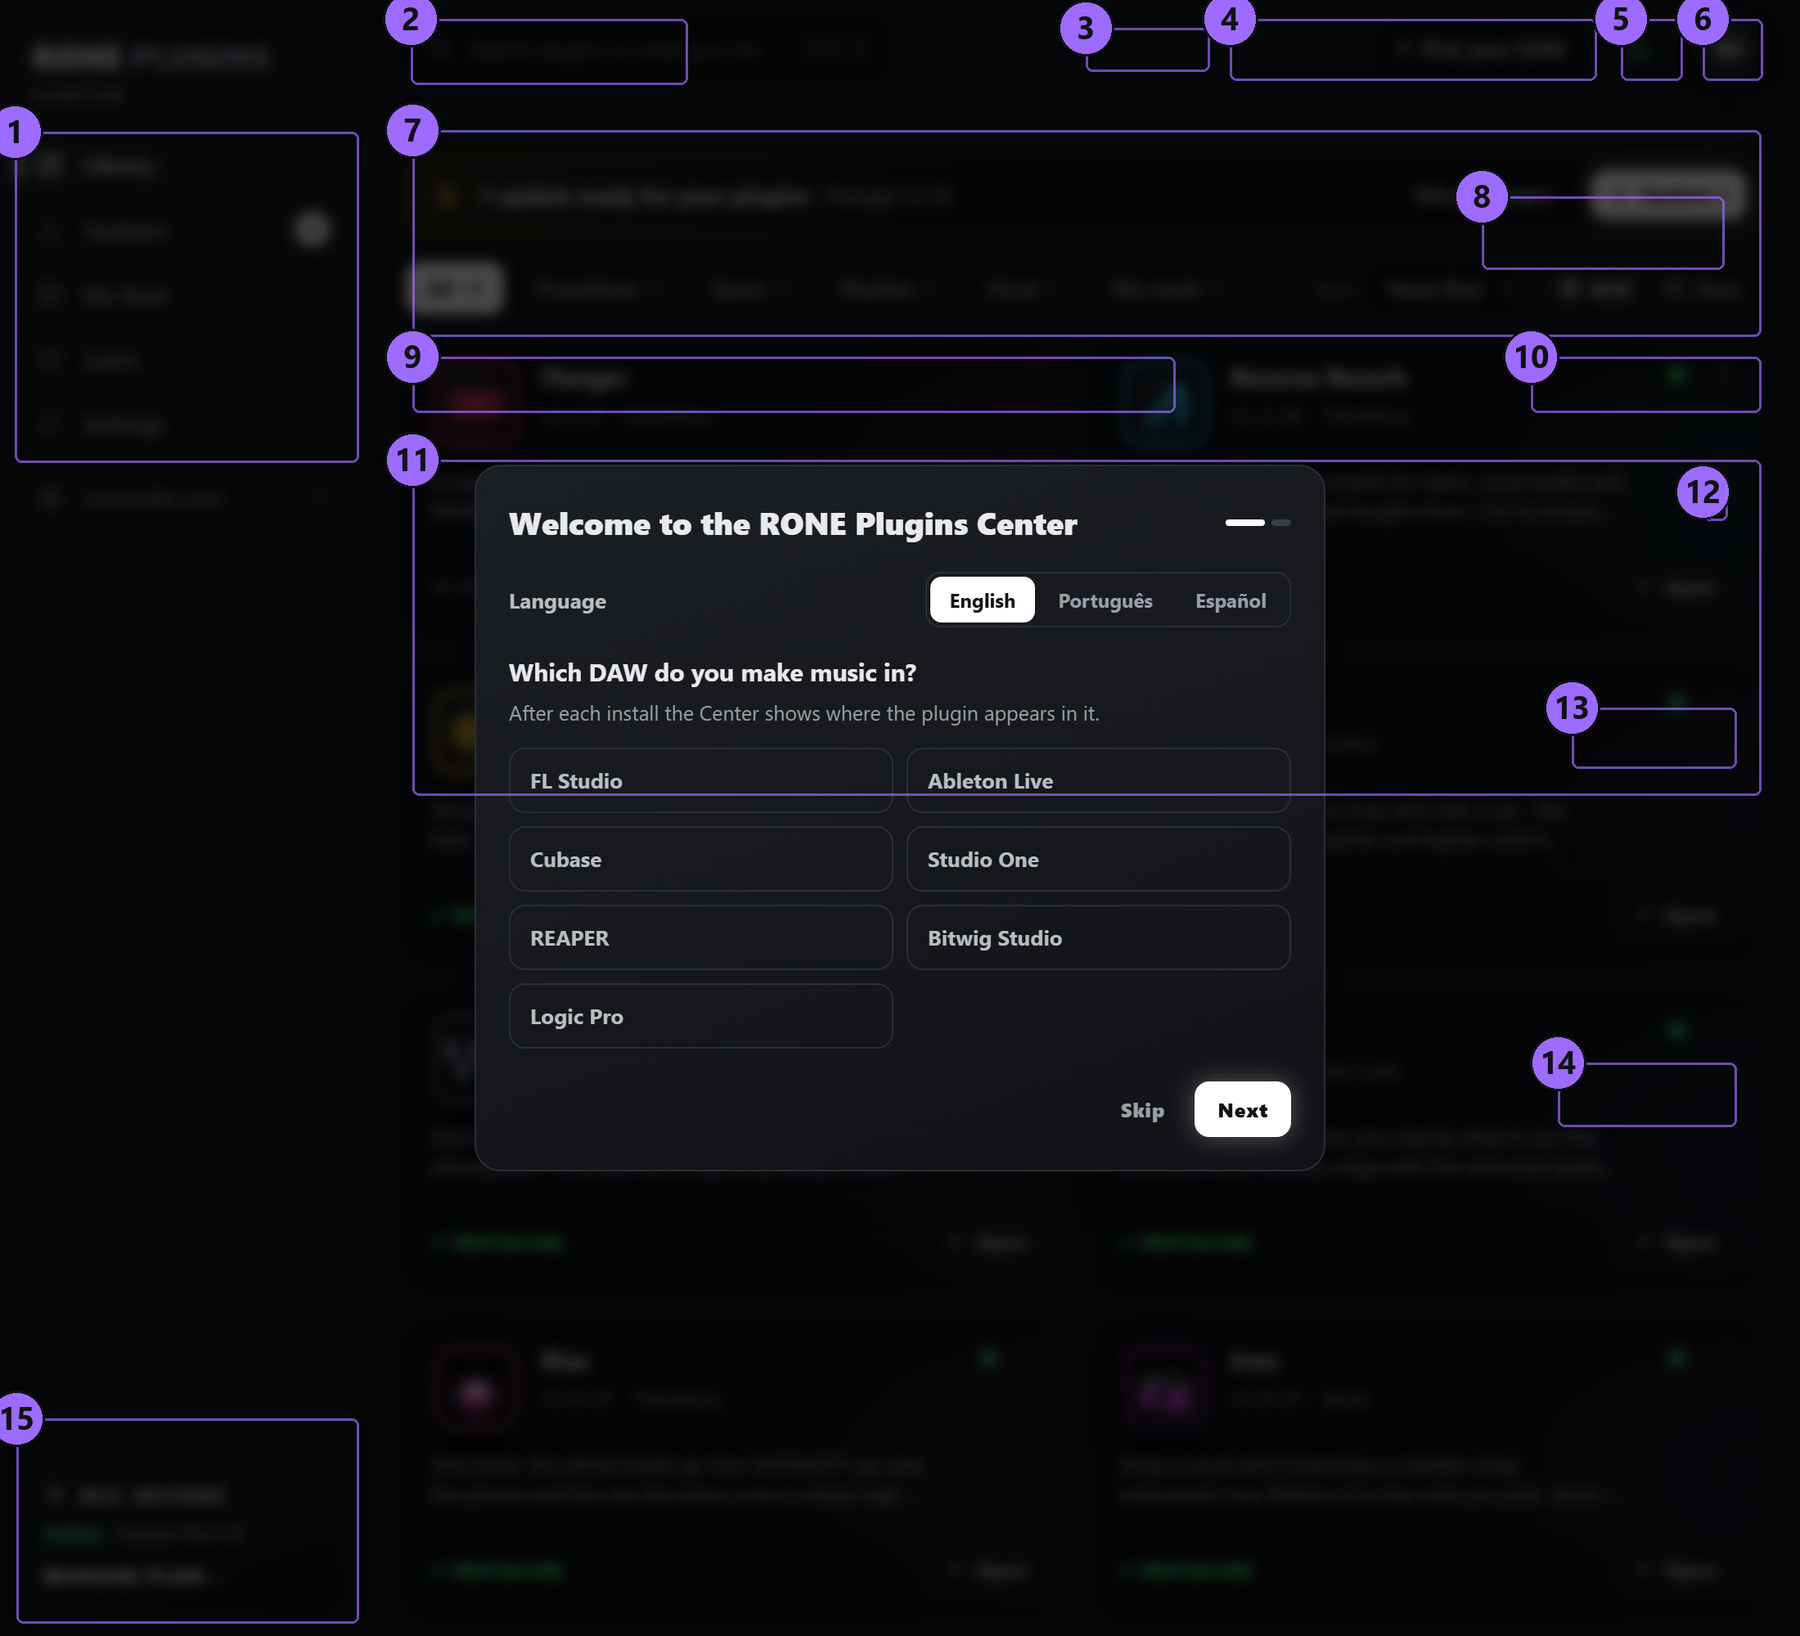
Step by step
- Download the Center from roneaudio.com and run the installer (Windows:
RONE_Plugins_Center_Installer.exe, macOS:RONE_Plugins_Center.dmg). On Windows the installer also adds the Microsoft WebView2 runtime if your PC does not have it yet; it is required for the plugin interfaces. On macOS (10.15 Catalina or later, Intel and Apple Silicon) open the .dmg and drag the Center onto Applications. It is signed and notarized by Apple, so macOS only asks once whether you want to open an app downloaded from the internet: press Open. - Open the Center and sign in with your roneaudio.com account (the same e-mail and password you used on the website). Your licences and device slots are checked automatically: an active ALL ACCESS plan unlocks every plugin, and a lifetime licence unlocks the plugin it was bought for — so RONE Analyzer opens either way.
- Find RONE Analyzer in the list and press INSTALL. The Center downloads the signed installer, verifies its checksum, installs it silently and registers the version.
- When the card shows INSTALLED, start (or restart) your DAW and rescan plugins if it does not pick up new plugins automatically. All RONE plugins appear next to each other in your plugin list because every name starts with RONE.
- Updates appear on the same card. Press UPDATE on one plugin or UPDATE ALL at the top. Close the standalone version of a plugin before updating it.
Where the files go
Windows
| File | Location |
|---|---|
| Standalone app | C:\Program Files\RONE Plugins\RONE Analyzer.exe |
| This manual | C:\Program Files\RONE Plugins\Manuals\ |
macOS
| File | Location |
|---|---|
| Standalone app | /Applications/RONE Analyzer.app |
| This manual | /Users/Shared/RONE Plugins/Manuals/ |
Licence and activation
Licensing is tied to your account, not to a key. The plugin checks the licence file that the Center writes when you sign in. There are two ways to own it: an ALL ACCESS plan, which unlocks every RONE plugin for as long as it is active, or a lifetime licence for this plugin alone, which never expires. Either one opens RONE Analyzer, and buying the lifetime licence later does not disturb a plan you already have.
If a plugin ever shows a RONE Bundle License Required screen, open the Center, make sure you are signed in and the plugin shows as licensed, then reopen it. Two devices can be signed in at the same time on either kind of licence; sign out on an old machine from the Center's Account page to free a slot. A lifetime licence keeps working offline for far longer than a plan does — there is nothing for it to expire against — but the Center still needs to reach the internet occasionally to confirm it.
Uninstalling
Windows: Settings → Apps → RONE Analyzer (RONE). macOS: delete the bundles listed above. Presets and settings in your user folder are kept.
3Quick start
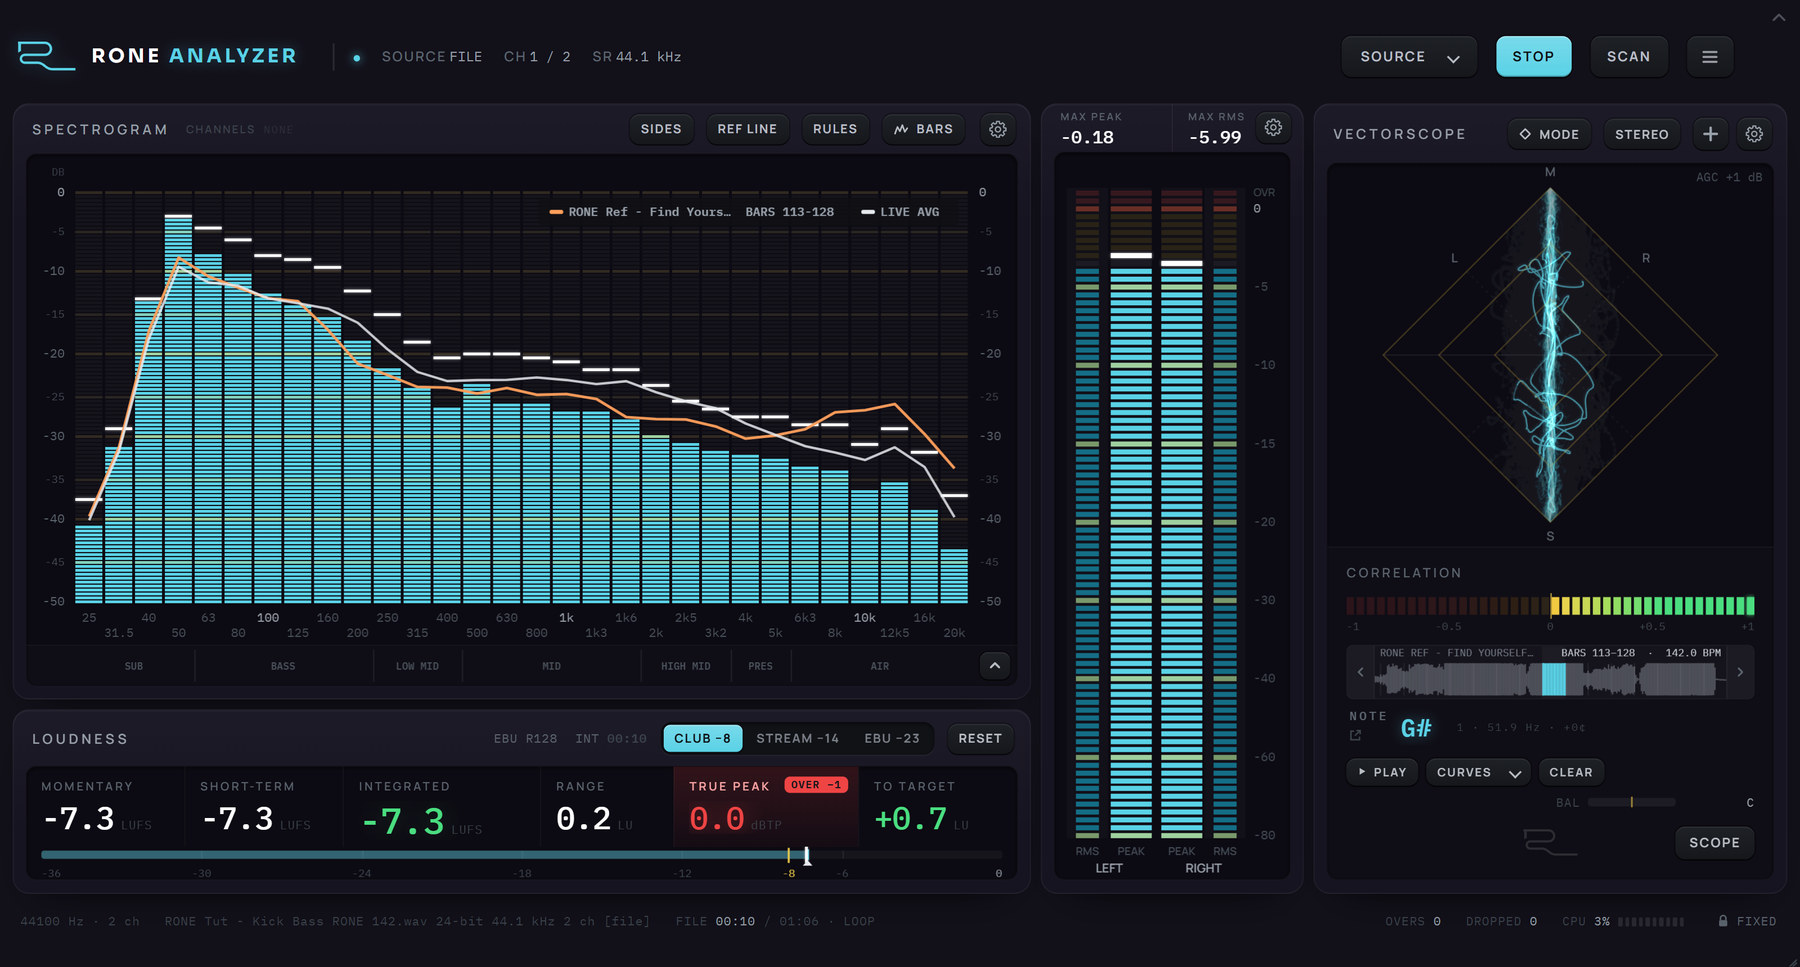
- Start RONE Analyzer from the Start menu (Windows) or Applications (macOS). It remembers its source, its settings, its theme and its window between runs.
- Measure the DAW. Insert RONE Analyzer Bridge on your master bus, last in the chain. The moment the plugin runs, the analyser switches to it by itself (its window says LINKED). Band solo, zone solo and the mono fold are then heard through the DAW.
- Or choose another source. Click SOURCE (or F3). The menu lists the DAW master, what the computer plays (no routing needed), your inputs, ASIO devices and other device types, a sample rate, and Analyse a file.... Under them, the channel pairs of the open source.
- Or open a file. Menu → Open a file and play to hear and measure it, or Open a file and scan to push the whole file through the meters in seconds. PLAY / STOP and SCAN then appear in the header; Loop the file is in the menu.
- Load a reference. Press REFERENCE on the right. Pick a record; its waveform comes up, the bright stretch is the 16 bars the curve is taken from, and the curve sits over your spectrogram. REF LINE / REF FULL chooses how it is drawn.
- Hear a range. Click a zone under the spectrogram - SUB, BASS, LOW MID - to hear only that range; press and hold a bar to hear one band. Escape lets everything back.
- Check the low end in mono. Press M, or the STEREO chip on the vectorscope. If the bass thins out, it is not mono.
- Give it the whole screen. The chevron at the top right, or H, takes the header and status bar away. Escape brings them back.
4Interface tour
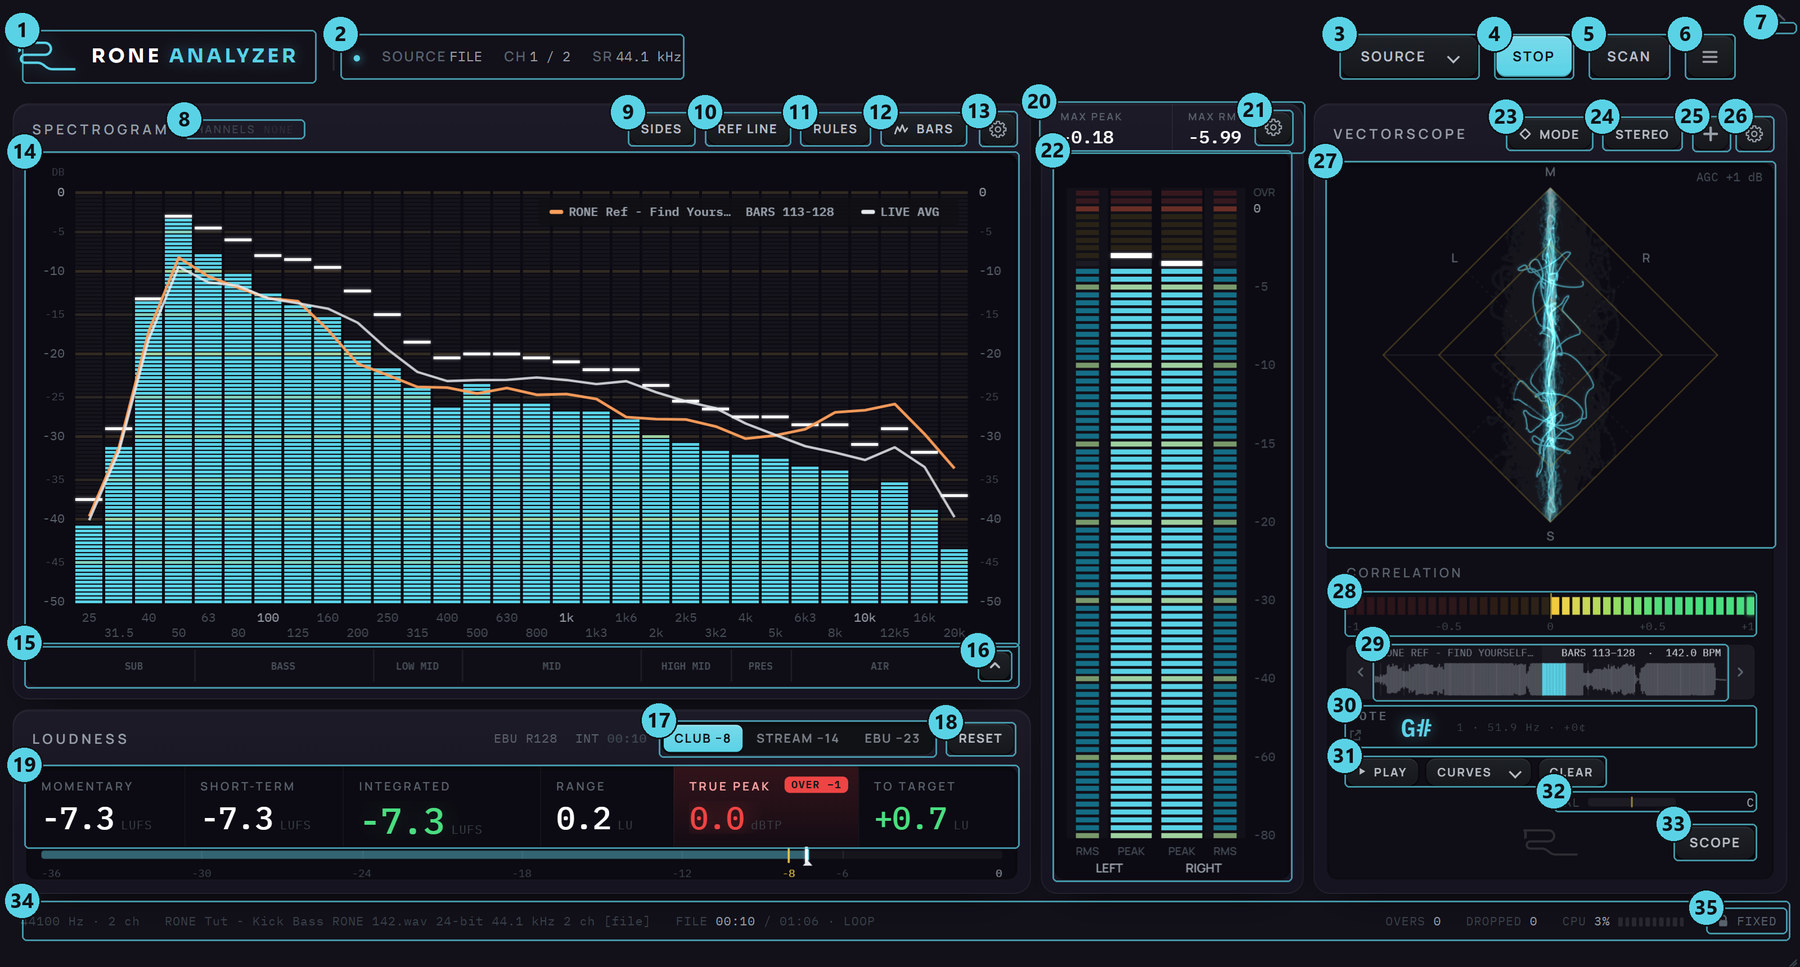
The window as it opens, with a file playing, the LOUDNESS panel open and a reference record loaded. The BAR SCOPE (SCOPE, bottom right) and the second vectorscope (the + on the vectorscope's title) open as extra panels and are described in the reference section.
5Spectrogram
Thirty third-octave bands of LEDs, 25 Hz to 20 kHz. The white LED on each column is the held peak. The gold rows across the plot are the 10 dB rules, the fainter ones the 5 dB rows. Hover a band for its readout.
BARS is the third-octave analyser. WAVES is the FFT spectrum: a 2048-point Hann window, 50 % overlap, a 2-second average, a 4.5 dB per octave slope and a -78 to -18 dB scale, so it reads like the spectrum analysers everyone knows. The reference and your Channels are drawn in both.
In BARS the gear opens the analyser's setup: how many bands, the range and the resolution of the scale, the decay and rise time of the bars, the peak hold, and whether the 5 dB rows are drawn. Freeze holds the bars where they are (F; the FROZEN badge shows while it is on).
In WAVES the gear opens the Spectrum Mode editor: routing (stereo, mid, side), window, type, block size, overlap, averaging time, the frequency and level range, slope, offset, smoothing, a filled display, a second spectrum, anti-alias, ALIGN 0 DB and BYPASS. DEFAULT puts the factory mode back. Drag a knob up or down, use the wheel (Shift for fine), double-click to type.
One click hides the 5 dB rows, the next hides the 10 dB rows too, the next brings them all back.
Paints the side signal (L minus R) over the bars in violet: what is wide, band by band. A mono mix shows none. A band whose violet reaches the cyan is as wide as it is loud - wide bass, usually.
The strip under the frequency numbers. Click a zone to hear that range alone; click more to add them. Right-click one to solo just it. Esc lets everything back. Through the Bridge the solo is heard in the DAW; on any other source it is drawn on screen and heard on the reference player.
Hear only that band. Drag while holding to sweep across; the wheel narrows or widens the band; a double-press latches it, and Escape or another double-press releases it. The shaded width is the filter's own -3 dB width.
Put RONE Analyzer Channel on a mixer channel, name it in the plugin (KICK, BASS, VOX), pick one of its six colours, and it appears here as a chip in that colour, drawn over the master with the master's own LEDs. Click a chip to show or hide it, S to see it alone, right-click to hear it alone (every other Channel ducks). Drag the chips left and right to set the drawing order: the rightmost is drawn on top. The MIX chip is the master itself - drag it among the Channels to put the master above or below them, or click it to hide the master and see only your Channels. Up to eight Channels; the row scrolls when they do not fit.
How the reference record is drawn. LINE: its curve over the plot, with the live average in white beside it, and a legend naming the record and its bars. FULL: the whole record in its own colour behind the live one - as bars in BARS, as a spectrum in WAVES - at the record's own level, so muting your kick does not move it.
6Meters, scope, reference
Level meters
Ten LEDs a step. The rows from -3 dB up are yellow, the OVR rows red: they light on an over and stay lit until RESET. The white LED holds the peak.
The loudest moment since the last reset: the largest sample, and the RMS averaged over 217 ms of the louder channel - read the way a clipper reads them. Click either to restart.
How far down the scale goes, how long a peak is held, how fast the meters fall, and how many consecutive full-scale samples count as an over - one clipped sample is not an over.
Vectorscope
A phosphor picture of the stereo image: every sample step leaves a dot, brighter the slower the beam moves, with afterglow. A thin vertical line is mono; a wide cloud is wide; a line leaning to L or R is a balance problem. MODE switches the frame between the diamond and a circle. V toggles LOCKED (the trace stays inside the diamond) and FREE (it runs to the frame). The AGC reading in the corner is how much the picture is being lifted; the gear sets the afterglow and the AGC.
Every click folds further: SIDES is the mix with its mid taken out, MONO is the fold. Every instrument then measures the fold - the meters drop wherever the channels were fighting, the spectrum changes shape, the trace stands as a line - and with the Bridge on the master the DAW plays the fold too (the dot on the chip lights while the Bridge is there). The fold never survives a restart.
A fourth column with a second scope. Its sources are chips: the loaded reference record, by its name, or any of your Channels, in its colour - the reference's image beside yours, or the kick alone. With nothing loaded it says ADD A REFERENCE OR A CHANNEL. The X closes it.
+1 is mono-safe, 0 is wide, below zero cancels in mono; the LED bar lights from zero to the reading, red on the cancelling side. BAL is the left / right energy balance in dB.
Reference
Load a record to compare against. It is analysed in a few seconds; its waveform comes up in the strip with its tempo, and the 16 bars the curve is taken from are the bright stretch - click anywhere on the waveform to move it there, the arrows step 16 bars back or forward. The curve sits over the spectrogram (REF LINE / REF FULL) and the record is a source for the second vectorscope.
PLAY plays the reference's 16 bars, round and round, on this computer's output. Through the Bridge the button becomes DAW / REF: an A/B that mutes the DAW while the reference plays, so you switch between the two with one click and the meters follow. Band solo, zone solo and the mono fold apply to the reference as they do to the mix.
CURVES keeps the current curve under a name and brings back any curve you kept - a saved curve needs no record. CLEAR removes the reference and brings the REFERENCE button back.
The note under the mix - the fundamental of the bass or the kick, from the analysed pair - with its octave, its hertz and how far off the note it sits, in cents. The small arrow pops NOTE out into a little window that stays on top of everything: put it over your EQ. Its X closes it; it remembers its place.
LOUDNESS
Closed until you ask for it: the small arrow at the bottom right of the spectrogram, or L, opens the panel under it, and the same arrow puts it away. It measures all the time, open or closed.
Momentary (400 ms), short-term (3 s) and gated integrated loudness in LUFS, loudness range in LU, 4× oversampled true peak in dBTP (rounded up to the next 0.1 dB, so the number is never under the peak it stands for; OVER -1 lights above -1.0 dBTP), and the integrated value's distance from the target. INT counts the audio integrated since the last reset; the gauge under the numbers shows integrated against the target.
A club or DJ master at -8 LUFS, streaming (Spotify, Apple Music, YouTube) at -14, broadcast at -23. The gauge and TO TARGET measure against the chosen one.
Restarts Integrated, Range and the true-peak hold from zero; Momentary and Short-term keep running. The menu's Reset all measurements does this and clears the overs and held peaks everywhere.
BAR SCOPE
A strip under the instruments: the waveform locked to the DAW's bar, so every pass of the loop lands on top of the last. The window is 4 BARS down to 1/8. Hold and drag up to zoom, sideways to scroll; double-click for the whole window; the wheel stretches the wave taller or flatter (the HEIGHT chip shows the stretch and puts it back); Shift-drag slides the trace onto the grid (the OFFSET chip puts it back). HOLD keeps a ghost of the loudest pass, so a beat without a kick fades the picture instead of erasing it. Your Channels are drawn in their colours: the chip cycles MIX + CH, CHANNELS, MIX. It needs a tempo and a position - the Bridge's, or a Channel's.
7Step-by-step workflows
Compare your mix to a reference
- REFERENCE → pick a record in your genre. Click the waveform to put the bright 16 bars on its drop.
- Set your DAW to loop the drop of your own track. The reference curve sits over your bars; the white line is your live average.
- Where the two disagree, click that zone (or press and hold the band) to hear it alone - in your mix, and with DAW / REF, in the record.
- Open the second vectorscope (+) and put the record in it: width beside width.
- Fix it in your EQ, and watch the white line move towards the orange one.
Measure the master through the Bridge
- Insert RONE Analyzer Bridge last on the DAW master, after the limiter. The analyser switches to it.
- Open LOUDNESS (L), choose the target, press RESET and play the whole song.
- Read Integrated, Range and True Peak; OVER -1 must not light for a streaming master. The meters' OVR rows must stay dark.
- Menu → Bridge bypass to compare with and without your master chain while watching the same meters.
Kick and bass
- Put a RONE Analyzer Channel on the kick and one on the bass; name and colour them in the plugin. Both appear over the master.
- Click SUB and BASS to hear only the low end. Read NOTE: it is the note the bass is actually sitting on.
- Press M. If the low end thins out, part of it cancels in mono - look at SIDES to see which band.
- Open SCOPE at 1/4 and watch the bass against the kick's tail, pass after pass.
Check a delivered file
- Menu → Open a file and scan. The whole file runs through every instrument in seconds.
- Read LOUDNESS (integrated, true peak), MAX PEAK and the overs.
- Menu → Open a file and play to listen to any section that looked suspicious; Space stops and starts it.
8Recommendations
Do
- Keep the Bridge last in the master chain, after the limiter, so you measure what leaves the DAW.
- Compare against the reference on the same 16 bars of both tracks, at the same spot in the arrangement.
- Reset before measuring integrated loudness, and let the whole track play.
- Put it on a second monitor and press H. The instruments are then as large as the screen allows.
- Use FULL to see the record whole, LINE to see your average against it.
Avoid
- Reading "what the computer plays" while the DAW runs on ASIO - it will read silence. Use the Bridge, or the ASIO source.
- Judging width by correlation alone; SIDES tells you which band it is coming from.
- Leaving a band or a zone soloed. It changes what you hear; Escape lets everything back.
- A Channel plugin from an older version beside a newer analyser - update both from the Center, they ship together.
Reading tips
- The white LED is the held peak; the lit column is the level now. A column whose peak sits far above its LEDs is transient, not loud.
- A hard-panned element shows in SIDES at its full level. That is physics, not a problem; a kick in SIDES is.
- TRUE PEAK rounds up. A meter that rounds to nearest can read 0.1 lower on the same file.
9Interface conventions
The menu
The button at the right of the header: Open a file and play, Open a file and scan, Play / Stop and Scan the whole file again for the loaded file, Loop the file; Appearance (F4); Reset all measurements, Restore default layout; Bridge bypass while the Bridge is in the DAW; Always on top; Start with Windows; Hints: a tour of everything (F1); About; Quit.
| Key | What it does |
|---|---|
F1 | The Hints tour. Arrows step, Escape ends. |
F2 | Setup - the spectrogram's, the meters' and the scope's settings. |
F3 | The SOURCE menu. |
F4 | Appearance. |
H | Hide the chrome: the header and the status bar go, the instruments fill the window. Escape brings them back. |
W | BARS / WAVES. |
F | Freeze the spectrogram's bars; again to let them go. The meters and the scope keep running. |
L | Show or hide LOUDNESS. |
M | Fold to mono - on screen, and in the DAW through the Bridge. |
V | Vectorscope LOCKED / FREE. |
O | Open or close the BAR SCOPE. |
Space | Play or stop the file that is the source. |
S | See the Channel under the pointer alone. |
Escape | Let go of a band or zone solo; close a panel; bring the chrome back. |
| Drop an audio file on the window | Analyse it. |
| Close the window | Quit. Source, window, theme and layout come back as they were. |
| Command line | --file <path>, --scan <path>, --reference <path>, --loopback [name], --bridge, --asio [device], --input <device>. Without arguments it reopens the last source. |
Appearance
Appearance in the menu (or F4) opens the theme panel over the right of the window; the instrument behind it is the preview and changes as you choose. Eleven built-in themes - RONE, Graphite, Ice, Phosphor, Ember, Fjord, Tokyo, Mocha, Rose, Solar, Mono - and your own. Meter colour is the level ramp or the theme's own colour; meter style LED segments or solid bars; the 5 dB rows can be shown or hidden. Customize sets every colour - surfaces, meters, marks and text - by swatch or hex, with Copy and Paste on every row so one colour can be matched across panels. Save keeps your colours under a name, Set as default marks the theme that Reset returns to. Nothing is kept until Apply theme; Cancel or Escape puts everything back.
The window
The grip at the bottom-right corner resizes the whole instrument. FIXED (the lock in the status bar) keeps the window's shape and zooms the instrument with it; FREE lets it take any size. Source, channel pair, every setting, the theme and the window position persist between runs.
Settings
The spectrogram's, the meters' and the scope's gears each open their own section of Setup; F2 opens them all. Every value applies at once.
10Troubleshooting, specifications and support
Troubleshooting
| Symptom | What to do |
|---|---|
| The analyser shows silence on a device that is playing | Applications on ASIO or in exclusive mode bypass the system playback path. Insert the Bridge on the DAW's master, or choose the ASIO source; on an interface with its own mixer, a loopback of that submix makes the playback appear as an input. |
| A source is greyed out or 'something else is holding this device' | Another application has the endpoint in exclusive mode. Close it, or pick a different endpoint. |
| The DAW master entry says 'insert RONE Analyzer Bridge on the master' | The Bridge is not running in the DAW, or the DAW has not scanned it yet. Rescan plugins; on Windows the Bridge is at C:\Program Files\Common Files\VST3\RONE Analyzer Bridge.vst3, on macOS in /Library/Audio/Plug-Ins/VST3 and Components. Its window must say LINKED. |
| A Channel is in the DAW but no chip appears | An older Channel plugin beside a newer analyser, or a project opened before the plugin was updated. Update from the Center (the Analyzer and its plugins ship together) and reopen the project. |
| Zone or band solo is only drawn, not heard | Only the Bridge plays the solo in the DAW. On other sources it is on screen, and on the reference player. |
| The BAR SCOPE stays empty | It needs a tempo and a position: the Bridge's, or a Channel's. A file or an input has neither. |
| macOS: 'Listening to an output needs macOS 14.2' | Older macOS cannot tap an output. Insert the Bridge on the DAW's master, or route the output through BlackHole. |
| The window opened off-screen or at a strange size | Menu → Restore default layout, or switch FIXED to FREE in the status bar and resize. |
| The plugin does not appear in the DAW | Rescan plugins. On Windows the VST3 lives in C:\Program Files\Common Files\VST3\RONE; make sure that folder (or its parent) is in the DAW's VST3 search path. On macOS restart the DAW after installing; Logic and GarageBand may need a full AU rescan. |
| The window is blank or shows an error page (Windows) | The Microsoft WebView2 runtime is missing or damaged. Reinstall the RONE Plugins Center; it repairs WebView2. Also check that WebView2Loader.dll sits next to the standalone executable. |
| The window is white in Ableton Live but the standalone works (Windows) | Turn off Live's auto-scaling for this plugin: in Live's browser open Plug-Ins, right-click the plugin and untick Auto-Scale Plug-In Window, then delete the plugin from the track and insert it again. Seen with Windows display scaling at values such as 110 %. |
| A licence screen appears | Open the RONE Plugins Center, sign in, confirm your plan is active, then reopen the plugin. Check that you have not exceeded your device limit. |
| The plugin shows an older version than the Center | Close every DAW and standalone RONE app, then press UPDATE again. A running standalone keeps the old executable locked. |
| Crash | RONE plugins write a crash report to your user folder; the Center uploads it the next time it runs. Please also tell us what you did right before the crash. |
Specifications
| Product | RONE Analyzer |
| Version | 1.3 (manual revised November 2026) |
| Formats | Standalone · VST3 + AU (Bridge, Channel) |
| Systems | Windows 10 / 11 (64-bit) · macOS 11 or newer (Intel and Apple silicon, universal) |
| Channels | Any stereo pair of the selected source; STEREO / SIDES / MONO fold |
| Sample rates | 44.1 kHz to 192 kHz |
| Latency | Not applicable (measurement only; the Bridge and the Channel pass audio through untouched) |
| Engine | Native analysis engine; the instruments are drawn in a web view |
Support
Website, presets, updates and support: roneaudio.com. When writing to us, include the plugin version (shown on the back panel), your DAW and operating system, and the steps to reproduce.